
By Carolyn Seng and Jack Halley
Australian football requires players to combine technical skills like passing, kicking, and tackling with the kind of speed and power displayed in rugby and soccer-like endurance to keep going strong all the way to the end of the fourth quarter. To monitor and develop such qualities, AFL teams use various technologies to feed data into an athlete management system (AMS) such as Smartabase, where it can be aggregated, visualized, and made actionable on the pitch, the training field, and in the gym. Below, we explore the top seven AMS integrations for AFL clubs.
External Load Monitoring
Technology: Catapult
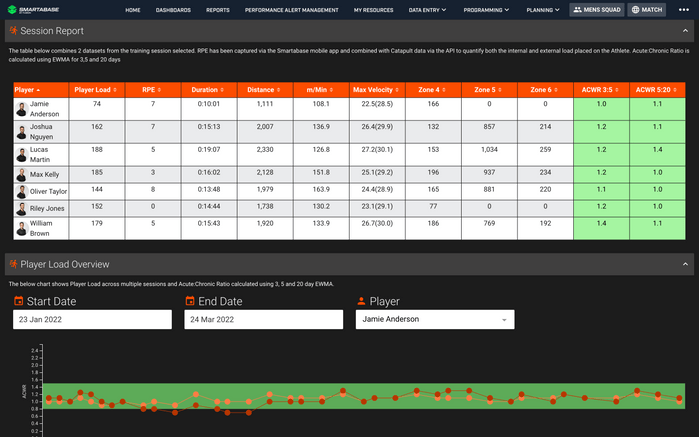
This is arguably the most important AMS integration for Australian rules football clubs. Catapult is the official leaguewide GPS provider in the AFL, so every team is using their systems to capture similar standardized metrics. Some of the most useful are total distance covered, number of high-speed runs/sprints, total high-speed sprint distance, and acceleration. Once this data is integrated into Smartabase, the performance staff can set up flagging to make sure a player’s output in training – which can be individualized for them or their position or pertain to average targets for the entire squad – sits within certain thresholds.
When an athlete is flagged for being outside these predetermined ranges, key personnel are automatically alerted. They can then use Smartabase to see if this is a one-off dip in performance or a trend that needs to be addressed. If such patterns were identified across the entire team, other factors such as the time of season and density of the competitive schedule could be looked at to see why there might be a decrease in practice performance and if the overall load is too high. The key is finding the sweet spot where players are fully prepared to handle the demands of competitive play without becoming overloaded.
Physical Screening
Technologies: VALD ForceDecks and KangaTech
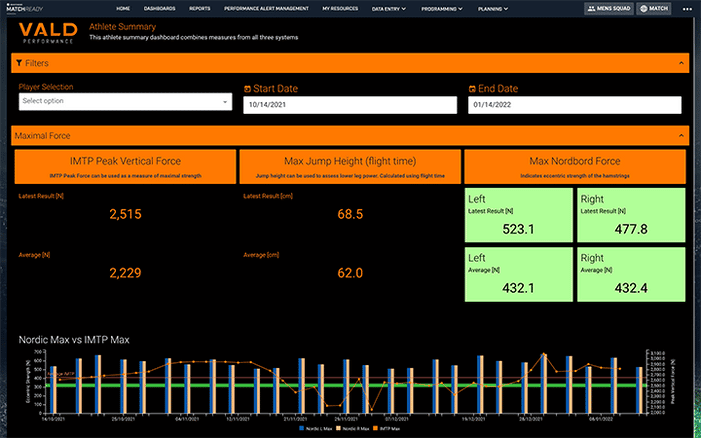
In addition to performing manual movement assessments like the Functional Movement Screen (FMS) and others administered by physios or athletic trainers, AFL clubs use systems from VALD and KangaTech to evaluate players’ movement quality, stability, mobility, and more. During the preseason, this technology can provide baseline measures for upper and lower limbs, range of motion around joints and in certain movement patterns, and force production from different starting points as athletes perform prescribed exercises or archetypal movements.
Managing this data in Smartabase enables staff to add such information into each player’s individual profile, identify any limitations that need to be addressed, and find imbalances or asymmetries that could have a detrimental impact on performance or even predispose an athlete to injury. During the season, physical screens allow clubs to perform week-to-week flagging. If there’s a significant increase in asymmetry or drop off from a previous baseline, they can use Smartabase to try and find reasons why and intervene if necessary.
Strength and Conditioning
Technology: TeamBuildr
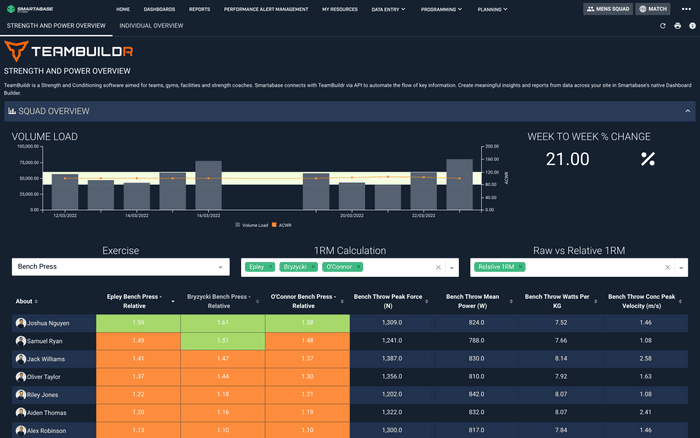
As Australian football requires players to be rugged on the pitch, they need to develop their strength and power in the weight room to prepare them for the rigors of competitive matches. This is where a strength and conditioning platform like TeamBuildr comes in. It allows coaches to go beyond the old pen-and-paper way of writing out programs and collecting athletes’ results so they can plan and execute sessions in a more efficient way.
One of the best things about TeamBuildr is that it allows coaches to bulk administer programs to AFL players. This makes delivering sessions to the entire 40-person squad simple from a staff perspective. It’s also more interactive for the athletes, who can use features like the weight room view, which splits the iPad screen into quadrants so four players can see their individualized workouts simultaneously on the same device.
There’s an intuitive interface for each athlete to quickly enter their actual totals for each exercise as well. Later, the S&C coach can go into Smartabase and compare these to the prescribed loads for that workout and see if there are any discrepancies that need to be addressed in the next session. Automating this kind of reporting saves time and allows the staff to focus more on interacting with the players and less on the kind of manual work they used to do in spreadsheets.
Recovery and Sleep Monitoring
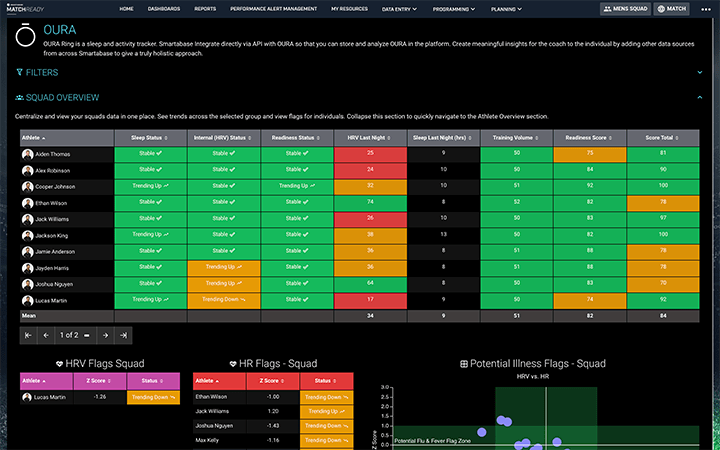
As important as it is to program effectively, it’s also crucial that AFL players get sufficient recovery to adapt to training stimuli and bounce back between practices and games. Wearables such as the Whoop Band and Oura Ring enable teams to assess this vital component without requiring staff or athletes to take any additional actions. It can be difficult to get players to comply when they have to self-report on sleep, fatigue, and other recovery indicators, whereas when they’re passively monitored using such technology, it helps drive compliance. Using such devices also gives the performance team insight into how players are recovering when they’re not at the team facility and there isn’t an opportunity for one-on-one touchpoints.
Wearable devices are getting better and better at monitoring players’ sleep. They can track how long an individual spends in each sleep stage and then combine this with other key metrics to deliver an overall rating out of 100. Once in Smartabase, this can be factored into the number of hours spent in bed to create a Z-score. If a player moves outside of preset parameters, the system will automatically flag them as moderate or high risk. Similar flagging could be set up for heart rate variability (HRV), overnight heart rate, fatigue, and other measurables to create a more comprehensive readiness profile.
Velocity-Based Training
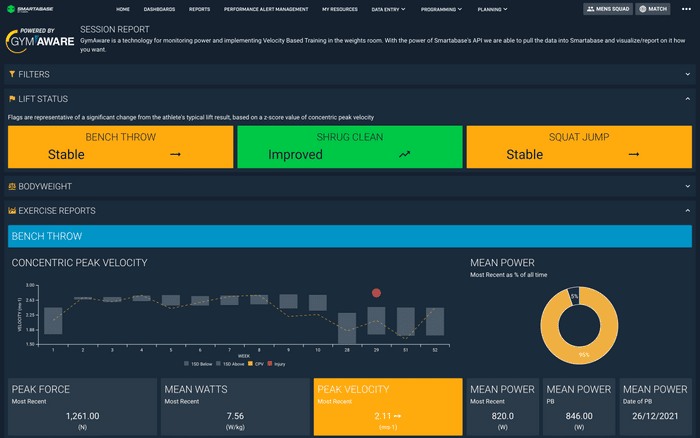
Technology: GymAware
In the AFL, athletes must be able to produce peak power to jump high, tackle hard, and run fast in single efforts and produce repeated bursts of speed throughout the game. There are practice pitch drills that can help them do so in the context of realistic match situations, but it’s also crucial to develop players’ capabilities in the weight room. GymAware enables strength and conditioning coaches to augment what they see when they’re watching athletes with objective data on how fast and powerfully they’re performing exercises like cleans, bench throws, and squat jumps.
This kind of velocity-based training (VBT) automatically provides acceptable ranges for athletes to stay in when they’re doing each movement. Visual and audible alerts can let them and the S+C coach know if they start to drift below the desired baseline, signaling that power production has dropped off. The athlete can then cut their set short and/or build in more rest before their next effort to help ensure their force and velocity output return to an acceptable level.
In the AFL, VBT tracking is used in conjunction with Smartabase in a similar way to how clubs utilize physical screens, allowing them to set peak velocity standards for players during the preseason and then flag any major changes in the data from week to week once competitive matches begin. When combined with GPS data from practices and non-VBT workouts, this starts to paint a nice, full picture of each athlete’s physical profile at any given moment.
Match Statistics
Technology: Champion Data
We’ve already mentioned the importance of capturing practice data via Catapult GPS and integrating this into their AMS. Doing so becomes even more useful when a team can aggregate and compare this with what happens on match day. Champion Data, the official system for measuring player performance during AFL games, allows coaches to look at things like player work rate and how this corresponds with the number of times they touch and carry the ball. They can also see the number of different types of kicks, handballs attempted and completed, and many more metrics that help identify successes and failures from each match that can inform subsequent training sessions.
Champion Data enables coaches to make tactical adjustments from week to week and also informs opposition scouting, as each team can see their aggregations of their opponents’ stats as well. Sometimes coaches struggle to get on board with data analytics because they feel it pertains more to the performance staff or medical practitioners than to their own day-to-day activities with the team. So being able to offer insight into how each match played out from an objective standpoint can increase coach buy-in by making data more relevant to them and their role. It can also be useful for players to see how they’re measuring up to both individual and team goals during league play.
Big Data/Analytics
Technology: R
As two of our colleagues touched on in a previous post, integrating an AMS with a third-party statistical computing system like R can help provide additional data analysis capabilities. Creating such a link might not be in the best interests of an AFL team that’s just getting started with Smartabase, but for a club that has already established most of the other integration points we’ve mentioned, it’s something to consider as a way to make player data even more actionable. The R connector allows clubs’ sports scientists to extract data from their Smartabase site and perform additional analysis.
A system such as R can aggregate bigger data sets to create more detailed side-by-side comparisons of players, position rankings, and so on that allow athletes to better evaluate their continual development and coaches to make better selection decisions. This could be achieved by extracting players’ practice and gym data and compiling their minimums, maximums, and averages. A similar process can also be utilized to extract greater meaning from daily training session data that’s logged in the AMS. Once inside R, certain specifics – such as how much total distance or high-speed running each player logged during a five-minute drill – is processed and aggregated. Such calculations could be repeated for every activity in the team’s drill library.
This can then be sent back into Smartabase to populate the next day’s training plan so the coaching staff and players have more informed targets to hit in the upcoming session. The information could also be compared against daily and weekly load goals set by the performance staff to ensure the entire squad is match fit. Connecting R to Smartabase removes reporting work that could’ve previously taken hours in Excel or simply have been undoable because of a lack of computing power or an excessive amount of data.
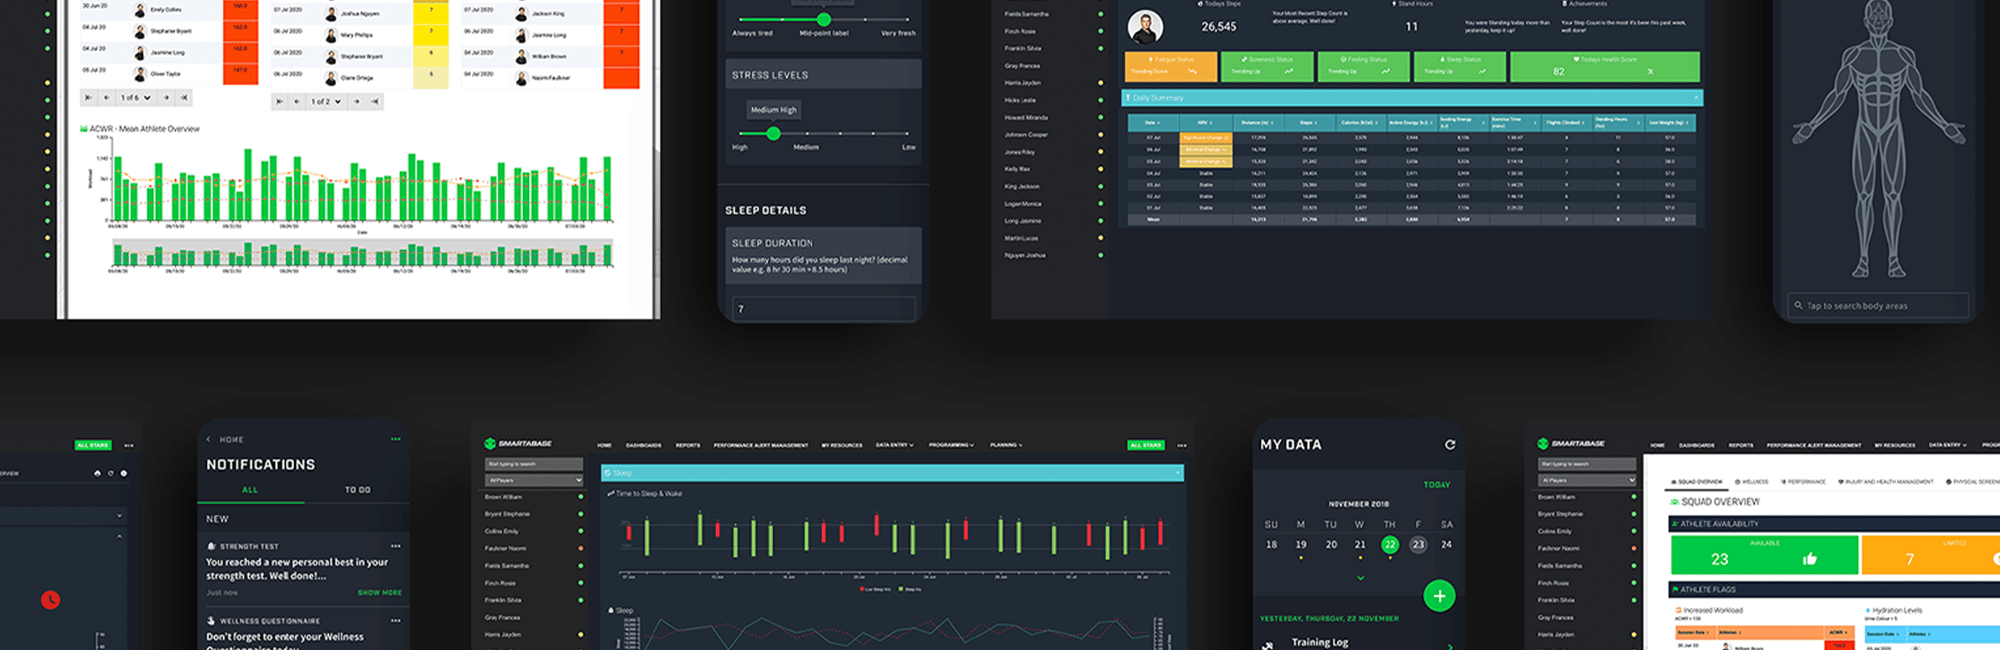
Smartabase Integrations
The Smartabase human performance platform serves as the central hub for all your performance, health, and medical data. To learn more about all the available integrations, visit fusionsport.com/smartabase/data-aggregation.