
Football (soccer) was one of the first sports to effectively apply GPS tracking to player training. Since then, clubs have become increasingly sophisticated in how they utilize quantitative and qualitative data to inform more individualized preparation, performance, and recovery. Let’s look at how teams are utilizing the Smartabase athlete management system (AMS) throughout the course of a typical training day.
Data Inputs
To make data-backed decisions on load management, availability, injury surveillance, and more, staff members need to consolidate a wide range of objective and subjective data inputs into a single, centralized platform. Smartabase integrates with more than 70 systems, apps, and devices, giving clubs a way to easily manage and aggregate all their data streams in one place via a site that’s custom built for professional football.
Wellness Questionnaire
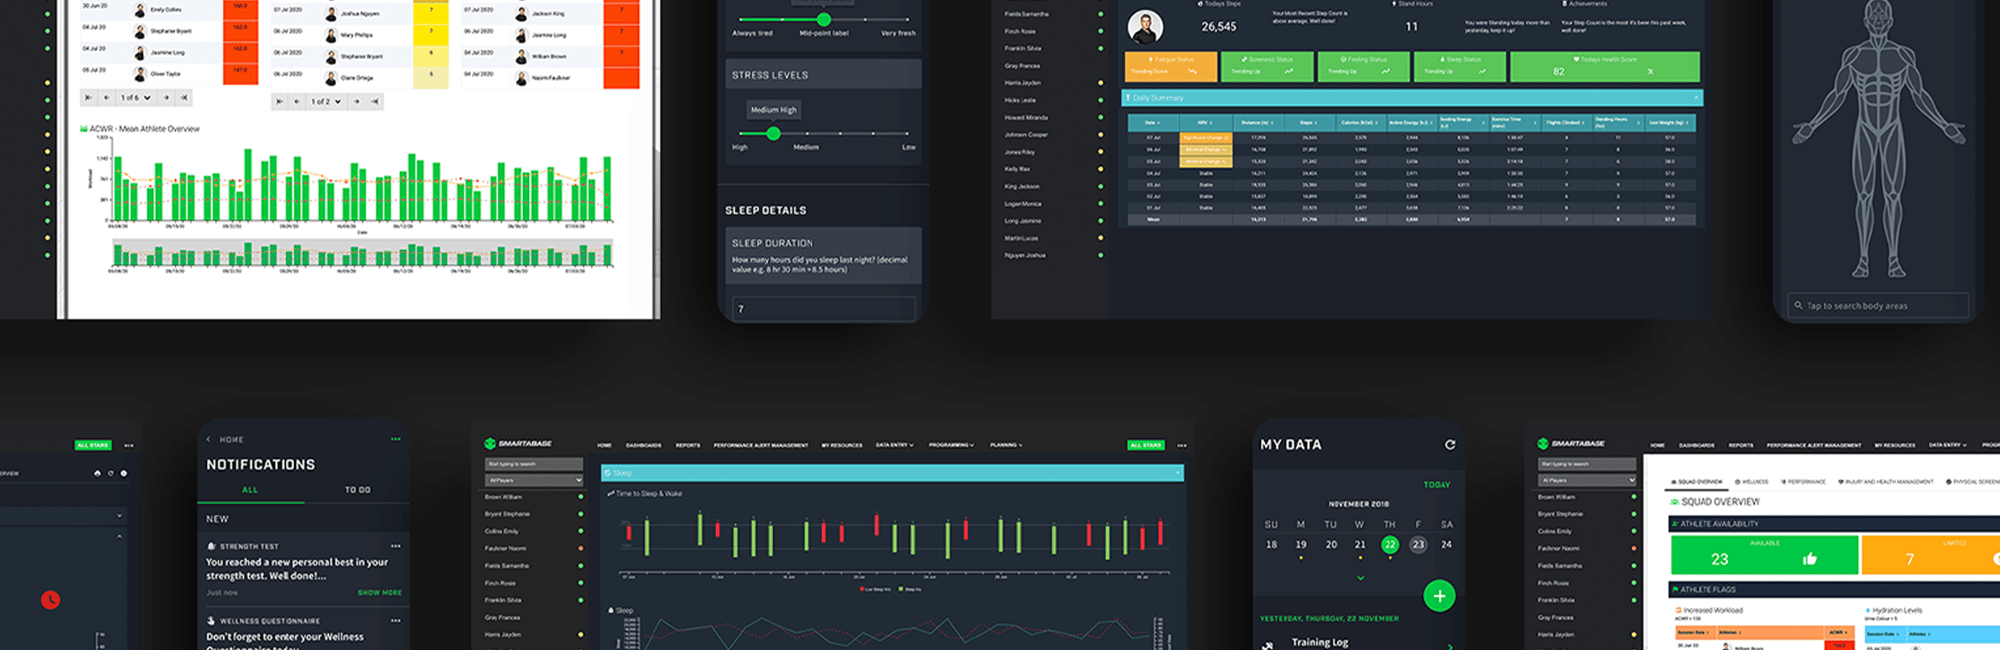
Once they get to the training facility, the players start their day by completing a brief wellness survey, using the Smartabase mobile app on their phone or the Smartabase Kiosk on an iPad. In just a couple of minutes, they answer questions about fatigue, sleep, and stress levels. This self-reported information provides another layer of context that complements objective data points. These questionnaires are completely configurable, so you can ask your players the questions that you feel are most relevant to their performance, recovery, and wellbeing.
Neuromuscular and Musculoskeletal Screening
Football clubs use systems like VALD ForceDecks, NordBord, and ForceFrame to regularly screen their players. This technology can be used to inform power, strength, and speed development and compare players’ output during the seasons to their individual baselines from pre-season training. It’s also useful for detecting decrements in neuromuscular readiness, increases in asymmetry, and declines in force or velocity, any of which could indicate that a player is overtraining or under-recovering. Staff can also enter the results from manual tests like sit and reach and knees to wall using the Smartabase Kiosk via an iPad. In our day in the life example, such testing takes place after the performance team’s morning meeting.
Load Monitoring
Once players get onto the practice pitch for a team session, GPS sensors capture the individual workload of every squad member using movement- and intensity-based parameters. This can relate to physical metrics, like total distance covered, maximum velocity, and amount of high-speed running, or drill-specific insights. Once imported into Smartabase, GPS data is automatically combined with information from physical screenings, wellness questionnaires, and other inputs to create a holistic view of what loads players are being exposed to and how they’re responding in a Readiness Report. Players can also enter their rate of perceived exertion (RPE) for the session via the Smartabase Kiosk or mobile app so that the performance team can see their subjective impression of how hard or easy a training session was next to the objective numbers that quantify it.
Metrics and Analysis
Consolidating all of the inputs detailed above provides football performance staff with a wide-ranging view of every squad member’s current status, including their medical availability, overall readiness, and injury risk. For objective physical screening data and subjective wellness information, each player is given an individualized Z-score. This allows Smartabase to assign a color-coded flag if someone is outside their normal range. Acute-to-chronic flags for key GPS metrics are calculated using the standard thresholds. Flagging can prompt intervention by a coach or practitioner.
Certain members of staff, like sport scientists, will likely want to dig deeper into players’ load data, and can use the Load Management dashboard to do so. This starts with a squad overview, allowing you to quickly identify any spikes or decreases in load for the squad and also shows acute-to-chronic values for select GPS metrics. Charts represent load in an acute time frame, like intensive and extensive load over the past week and match minutes for the past five most recent games.
The season overview section looks across the competitive calendar to help you understand the overall load players have experienced, how it compares to match values, and if any patterns or trends are occurring. The individual load canvas breaks down this data on a player-by-player basis. Using the filter at the top to select a player, you can then see if they have any flags, which can be set up to meet your KPIs. You could also add some textual feedback based on the criteria. At the bottom of this canvas is a load aggregator, where you can select a specific time frame to investigate the external load experience by this player during a set period.
Finally, the weekly analysis canvas allows sport scientists to evaluate a weeklong training block and see how it compares to others across the season. We can see a player’s load in a given training session and across a whole training week expressed as a percentage of their game reference values – which is the average of the last five games played. This can help determine if a player is being exposed to enough load to prepare them for match day demands or not so that you can adjust their training as needed.
Reporting
For a football club to make use of player data, they need to go beyond simply capturing information and actually be able to see it. This is where Smartabase’s versatile visualization options come in, creating graphical representations that make it easy for staff to view a snapshot of each player’s current output and availability and trends that occur over time. Data is aggregated and presented automatically in a customizable format. For example, the Readiness Report dashboard offers an objective overview of players’ current level of preparedness, including their availability to train and play and their relative risk of injury.
In our workflow, the first column shows the current medical status for all players, which will typically be set by the teams’ doctors or physios. This profile shows data from the subjective wellness questionnaire entered by athletes in the morning, the results of the most recent neuromuscular/musculoskeletal screening performed, and the current acute-to-chronic values for key GPS metrics. At any point, if you want to dive deeper into a specific player’s data, you can click on the individual trends canvas to do so. This will give you a more in-depth view of an individual, and help you identify any trends or patterns that may be occurring.
The Session Report dashboard is designed to give you a high-level overview of the team training that was just completed and allow you to evaluate individual and overall squad performance against similar previous sessions, on a specific match day (MD) code (for example, MD-2 is two days before the next game), or relative to average match values. For example, in yesterday’s practice you might see that players covered, on average, 90% of the distance they do on a typical MD-2.
In addition to such team-wide metrics, you can view a more detailed breakdown for each individual player and also compare all the squad members at a certain position. For example, if you wanted to assess only central midfielders, you could select them in the filter at the top of the dashboard to display the visualizations for this position group. There are also leaderboard charts for the squad that show how each player compared to the squad average in key GPS metrics. In addition to displaying data in dashboards, you can easily export it into a printable PDF to share with coaches or the performance staff. Selected metrics can also be shared with players via the Smartabase mobile app.
Action
The final step in our day in the life example is arguably the most important: the point at which a single significant change in the data or an overall trend prompts a coach or member of the performance staff to act upon it. The number of flags that a player has is summed in the final column of the Readiness Report to help you assess the relative risk of them getting injured. This column can quickly be sorted to show the players with the highest risk at the top.
If a player is at or near the top of the injury risk list or exceeds a certain number of flags, this could inform a group-based decision, such as squad selection for the next match or group training session planning. Smartabase also contributes to individualized actions, like restricting or expanding a player’s activities based on their medical status, emphasizing recovery when their wellness is compromised, and adjusting their intensity or volume on the pitch or in the gym because of their overall workload.
Switching to the availability canvas provides a breakdown of each player’s current medical status and training/performance for the latest session. The former is typically controlled by medical staff, but the latter can be updated to reflect the discussions you’ve had as an interdisciplinary group. This ensures that the input of coaches and performance practitioners is considered as you work through the Readiness Profile.
For example, there may be a player who is cleared to play on a medical basis, but based on their Readiness Profile, you feel an intervention is needed, such as decreasing their load today during team training. You can update their status by simply clicking on the row in the table, going into the Availability Record, and making the necessary change. Football clubs using these day-in-the-life workflows have reported time savings, increased accountability, improved communication, and more informed decision-making.